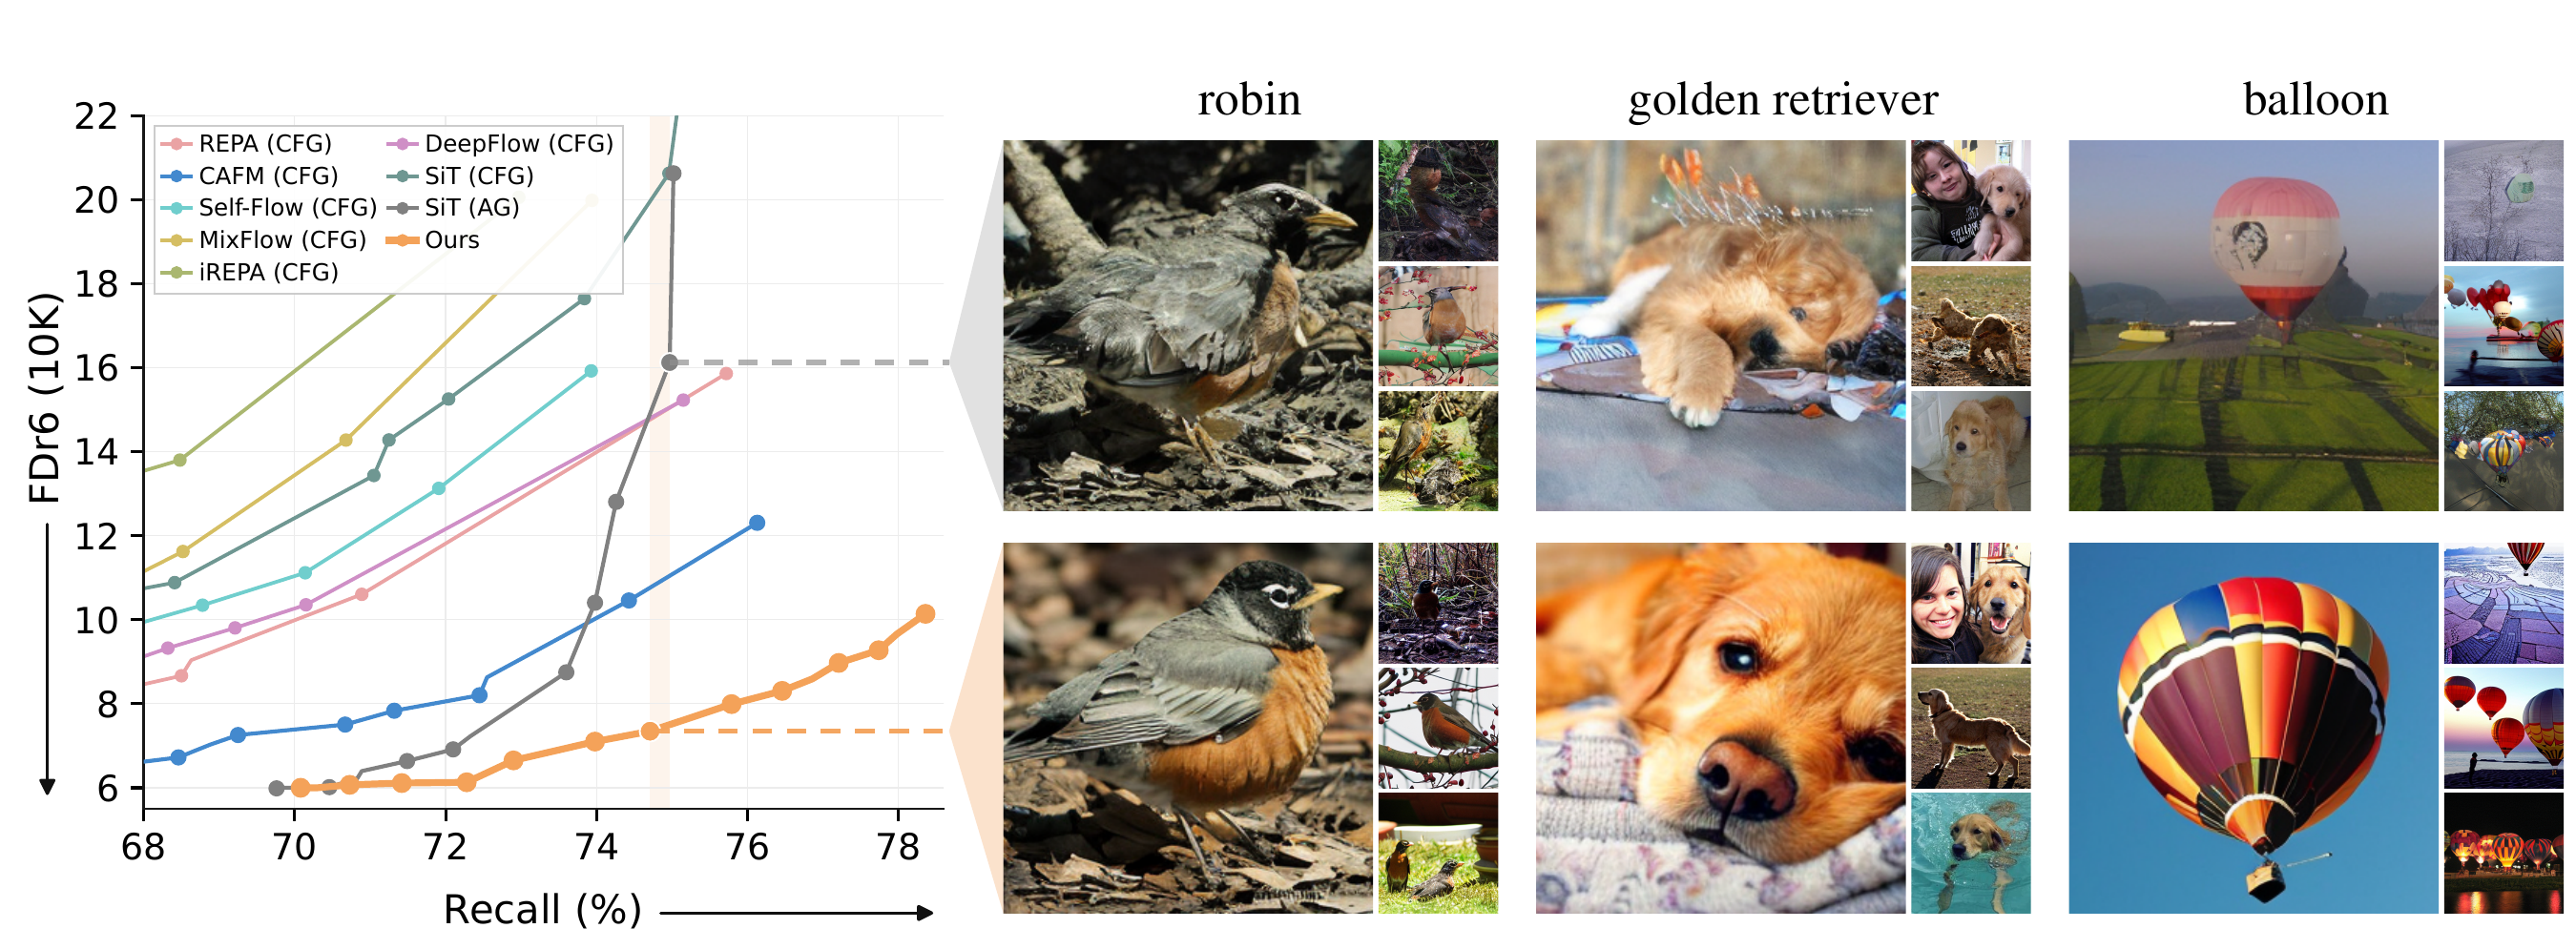
A successful generative model has two essential aspects: (1) high-fidelity, where each randomly drawn sample looks realistic, and (2) broad coverage, where the full data distribution is well-represented. Inference-time techniques such as classifier-free guidance raise quality, but at the cost of coverage. In this work, we demonstrate improvements in both quality and coverage, pushing the frontier significantly.
The plot on the left shows that while progress has indeed been made in quality (moving down the y-axis), the coverage of the distribution (x-axis) has been underexplored. Our method reaches substantially stronger performance in the high-coverage regime.
This is illustrated on the right using random samples, comparing samples obtained using the same class condition and initial noise before (top) and after (bottom) applying our approach over the SiT baseline.
ImageNet-256. Curves are obtained by sweeping each method’s inference-time guidance. CFG and AG denote classifier-free guidance and AutoGuidance, respectively.
TL;DR: Better image quality, with broader coverage.
We post-train flow matching generators by letting multiple predictions compete to explain each training target. With less than 3% of the original pretraining compute, this substantially expands the quality–coverage frontier shown above, with the largest gains at broad coverage.
Intuition: Same noisy state, multiple answers
Improving generation quality while maintaining broad coverage remains challenging. We hypothesize this limitation stems from a basic property of the flow matching objective.
We revisit flow matching through a 1D toy example: transporting a unimodal source distribution to an imbalanced bimodal target distribution.
Pair APair BFM prediction
This motivates our key insight: accommodate multiple alternatives with multiple predictions.
Method: What if the model could make K guesses?
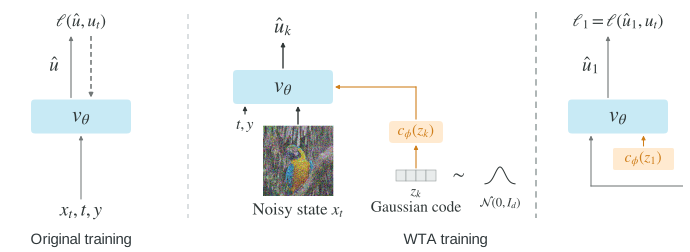
Instead of asking a single prediction to fit multiple possible targets, we give the model more room. We allow the model to make K guesses for the same noisy state and use only the best-matching guess to fit the current training target.
To allow the model to make multiple predictions for the same noisy state, we introduce a low-dimensional Gaussian code z as auxiliary conditioning.
Different samples of z allow the same model to produce different velocity predictions.
Winner-take-all training
During training, we sample K auxiliary codes, yielding K candidate velocity predictions for the same intermediate state. Only the best-matching candidate receives the regression loss—a winner-take-all (WTA) objective.
We now return to the 1D toy example to see what competitive training changes.
Different codes, different predictions
From predictions to samples
An additional inference-time control: two behaviors in one model
Flow Matching
FM prediction
← Mode SeekingMode Coverage →
After WTA training
Code 1Code 2
After WTA training, different auxiliary codes allow the model to produce different velocity predictions for the same noisy state. In this toy example, the predictions point toward the two target modes.
For each sample, we draw an auxiliary code and keep it fixed throughout the sampling trajectory. Here, all displayed WTA trajectories use one of two codes, starting from different noisy states. WTA training recovers both target modes while largely removing off-support mass in this toy.
Scaling the auxiliary conditioning cφ(z) by λ provides an additional inference-time control: λ = 0 removes it, leaving the post-trained base model, while λ = 1 restores its training-time strength.
Interestingly, at λ = 0 the model again makes a single velocity prediction, yet concentrates on the dominant mode rather than going off-manifold. Increasing λ brings back broader coverage.
A stronger generator after just 10 epochs of post-training.
Competitive post-training improves generation quality, including at matched and higher coverage than pretrained SiT. The same model also gains its own control: varying λ moves it from high-precision to broader-coverage generation.
Better quality across the displayed range. The orange points lie below pretrained SiT, with some also reaching further to the right.
Our model turns guidance into a win-win at high coverage.
Competitive post-training changes how the model responds to inference-time guidance. For pretrained SiT, stronger guidance improves quality at the cost of coverage. At high-coverage settings, our model instead improves quality while preserving—and sometimes increasing—Recall.
Follow the paths downward. Our high-coverage settings gain quality while retaining coverage. The bold orange line shows the resulting frontier.
Guided comparison under the standard 50K-sample evaluation
Method
(a) Performance @ best FDr,6 (50K)
(b) Performance @ Recall ≈ 67% (50K)
Multi-encoder Fréchet distances ↓
FDr,6 ↓
Recall (%) ↑
Precision (%) ↑
IS ↑
Multi-encoder Fréchet distances ↓
FDr,6 ↓
Recall (%) ↑
Precision (%) ↑
IS ↑
FID (ADM)
ConvNeXt
DINOv2
MAE
SigLIP
CLIP
FID (ADM)
ConvNeXt
DINOv2
MAE
SigLIP
CLIP
CAFM
3.30
85.58
51.49
0.13
5.06
58.31
4.86
57.1
83.8
342.7
3.84
225.73
135.82
0.24
10.91
106.67
9.84
67.3
72.1
181.9
REPA
4.79
132.70
52.50
0.19
5.69
60.93
5.65
49.7
88.0
388.8
6.42
302.84
171.30
0.37
14.43
136.53
13.13
67.2
69.7
162.5
MixFlow†
6.52
156.09
65.02
0.20
6.40
67.52
6.49
46.9
88.6
396.1
9.35
495.73
252.08
0.50
21.91
169.85
18.57
66.0 (below 67%)
68.0
133.5
Self-Flow†
6.37
147.99
55.50
0.18
6.05
60.74
5.94
46.5
89.8
388.1
7.63
400.46
197.52
0.35
16.29
143.51
14.51
66.1 (below 67%)
69.4
138.1
StableVM
5.47
140.84
52.32
0.18
5.75
60.29
5.72
48.0
88.6
391.1
7.45
360.07
188.04
0.38
15.46
142.35
14.14
67.9
68.7
147.3
DeepFlow
5.64
143.20
52.50
0.19
5.84
60.50
5.83
48.2
88.8
398.6
7.16
359.93
186.26
0.38
15.47
139.92
14.00
67.3
68.7
148.2
iREPA†
7.26
170.67
73.12
0.28
9.50
71.03
7.99
40.5
90.8
373.4
9.81
551.60
256.33
0.49
22.97
160.22
18.81
65.2 (below 67%)
67.9
117.6
SiT (CFG)†
6.52
150.02
62.21
0.20
6.53
64.86
6.40
46.6
89.2
383.7
11.17
572.67
275.86
0.47
21.39
177.22
19.22
66.9 (below 67%)
66.3
118.6
SiT (AG)†
2.13
85.92
50.46
0.11
5.26
52.29
4.53
62.2
78.1
236.9
11.17
572.67
275.86
0.47
21.39
177.22
19.22
66.9 (below 67%)
66.3
118.6
Ours
2.29
77.44
46.13
0.13
5.24
49.06
4.44
60.4
79.9
258.2
2.20
122.93
69.43
0.20
6.72
61.19
5.91
67.4
73.0
210.5
The advantage grows at broader coverage.
Lowest FDr,6 in both settings, with a larger advantage at high coverage.
† marks methods whose highest measured Recall is below 67%; these Recall values are gray in (b).
Generalizing to an even stronger generator.
We also post-train the already strong RAEv2 generator with our method, expanding its quality–coverage frontier in just 10 epochs.
RAEv2 performance comparison, 50K samples
Method
Performance @ best FDr,6 (50K)
Performance @ Recall ≈ 70% (50K)
FDr,6 ↓
Recall (%) ↑
Precision (%) ↑
IS ↑
FDr,6 ↓
Recall (%) ↑
Precision (%) ↑
IS ↑
RAEv2
2.07
64.72
79.39
261.68
16.83
69.09
52.39
111.47
Ours
2.02
65.71
78.30
265.82
3.18
70.32
71.25
182.39
Analysis: What does competition change?
Competitive post-training improves the base model itself. With auxiliary conditioning removed (λ = 0), the model shifts toward higher Precision and lower Recall than its pretrained counterpart. We vary K—the number of competing predictions during training—to examine the role of competition in SiT.
More competition, a higher-fidelity base model.
With K = 1, post-training leaves SiT nearly unchanged. As more predictions compete, Precision rises and FDr,6 falls under 50-step sampling.
The effect is stronger with fewer sampling steps.
As K increases, 4- and 8-step generation improve substantially, narrowing the gap to 50-step generation. Increasing K adds computation during training, without increasing sampling cost—shifting compute from inference to training.
Post-training improves the fidelity of the base model itself. Compare the original SiT generator with our post-trained model, with auxiliary conditioning removed.
OriginalOurs
Toucan
Irish setter
Samoyed
Tiger
Pitcher
Wreck
French loaf
Cheeseburger
Corn
Bolete
Cite
BibTeX
@misc{peng2026cfm,
title = {Expanding the Quality--Coverage Frontier with Competitive Flow Matching},
author = {Peng, Wenxuan and Zhang, Richard and Zheng, Haitian and
Singh, Jaskirat and Chen, Tsai-Shien and Shechtman, Eli and
Hariharan, Bharath and Averbuch-Elor, Hadar and Wu, Zongze},
year = {2026}
}